Content
- Google Drive folder (Week 2): https://drive.google.com/drive/folders/1nrgbt3h-U0OqWaP_ym88y2T7Wa8EBoZ8
As done in the previous week, open the folder for the week, then create a copy of the slide presentation within it. Rename it to your OdinId. Then, open the presentation to create slides showing the results of each exercise.
Setup
Based on the training data models utilize or on any fine-tuning and post-processing performed before releasing a model, it can exhibit bias. In this exercise, we'll examine one aspect of bias that can be measured with a simple application. Consider the following diag`ram of a program that generates stories based on occupations and then classifies the gender of the character in the story.

The diagram is easily implemented using a program you can run. Go to the Google Drive folder for the week and find the Occupational Gender Bias Jupyter notebook (.ipynb). Open the notebook.
Click on the "File" drop down and click "Save a copy in Drive". This will create a copy of it in your PSU Google Drive within the "Colab notebooks" directory.
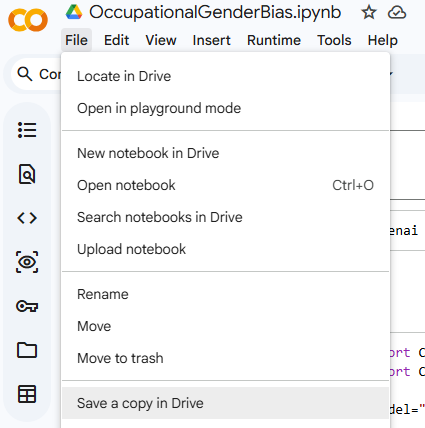
There are a set of cells implementing the Python code for the program. You will need to run these cells in the order they appear in the notebook for the program to execute properly. Hover over the first cell and click on the "Play" icon to execute the command within it.

Wait for a green check-mark that indicates the execution of the cell has completed successfully before continuing.

Scroll down to the second cell, ensure the api_key value is set with an API key. Then, run the cell to define the program.

The program generates a story about a carpenter and then tests the gender of the character in the story.
- Find the gender of the carpenter.
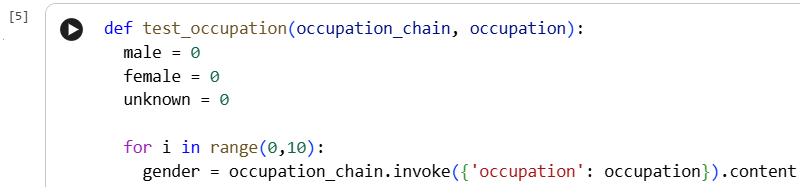
The next cell creates a function that takes an occupation as an argument, generates a number of stories, and tests the gender ratios that result. Run the cell to define the function.
Finally, the rest of the cells test a range of occupations. You may either test the ones given or change the occupations to ones you think of.
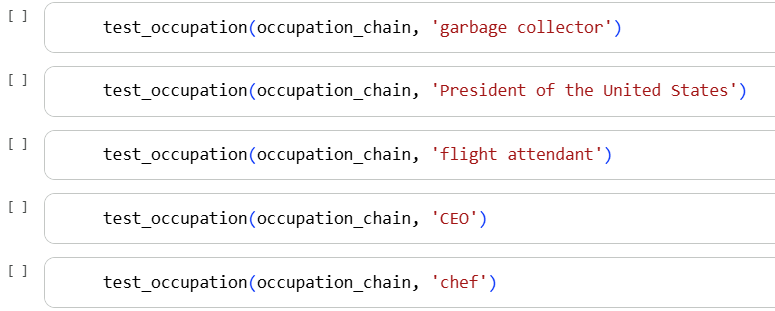
Evaluate the stories for several occupations, then visit the Bureau of Labor Statistics and find the current percentage makeup of the occupations you utilized. https://www.bls.gov/cps/demographics/women-labor-force.htm
- Add a slide to the presentation that compares the accuracy of the model's output when compared against the actual numbers for an occupation of your choice.
In a new chat session, prompt the model with the following question:
What are the top 10 news sources for total reach across all platforms in the USA?
Then, prompt the LLM over the trustworthiness of its response and the source it is using to justify the response.
How do I know these results are trustworthy? Which source did you use?
Then, ask the LLM to regenerate the results using the single most trustworthy source.
Using the most trustworthy source, answer my initial query again.
Then, have the LLM put the two responses side-by-side to see what changed.
- Add a screenshot to the slide presentation that shows the comparison. What changed in the responses when the trustworthy source was used?
Bias is often associated with any reporting. Have the LLM rank the sources based on their political bias.
Take the original list of news sources and rank them based on their political bias.
Then, ask the LLM to compare its results with those from AllSides.
Compare your ranking with AllSides https://www.allsides.com/media-bias/media-bias-chart
- Add a screenshot showing the differences, if any?
Find one source on each end of the political bias spectrum. Then, find a controversial topic which one might find a polarized response. Topics include:
- Iran war
- Immigration policy
- Voter identification
- Big vs limited government
- Regulation vs de-regulation
- Minimum wage vs unemployment
- Welfare
Repeat the following prompt for each source.
Using only content from <INSERT SOURCE HERE>, provide a 2 sentence justification of <TOPIC>.
Then, prompt the LLM to compare the responses and how they might show bias
Compare the two responses and how they show bias.
- Add a screenshot to the slide presentation that shows the results of the comparison.
Compare your local network news with the list of news sources in the previous step.
I live in Portland, Oregon. What are the top three local network news sources and rank them against national network news in terms of bias.
- Add a screenshot to the slide presentation that shows the results
Finally, ask for advice in avoiding bias.
What 3 steps can I take to avoid news bias from social media and AI?
- Add a screenshot to the slide presentation that shows the results
One can potentially address bias in the model by supplying context directly to the model and having it analyze it for bias before it is used to generate a response. Most models will automatically retrieve on-line source material if given a link in order to use its content as context in its response. Bring up a chat session on ChatGPT, Gemini, or Claude. Prompt the model to see if it can identify bias and whether or not it believes its criteria for determining it is biased.
Is the following article biased? https://www.huffpost.com/entry/rfk-jr-posts-unhinged-workout-video-with-kid-rock-that-must-be-seen-to-be-believed_n_6995d4e8e4b0cc086c6bc23f
Examine its analysis for judging bias. Then, ask it a meta-question about whether its criteria might be biased.
Are your criteria for determining this biased?
Then, prompt the model to rewrite the article in an unbiased manner.
- Include in your slide presentation a summary of the main criteria being applied in the LLM's response.
One of the uses for a service like Gemini Notebook is to be able to query information sources efficiently such as PDF files either uploaded from your computer or accessible via Google Drive. In this exercise, you will load up a PDF file for a subset of pages from the Portland State University academic bulletin related to Computer Science and ask it a question. Visit the Google Drive folder for the week and find the file named PSUBulletin-ComputerScience.pdf.
Then, visit the Gemini Notebook site, create a new notebook, and upload the PDF file into it.
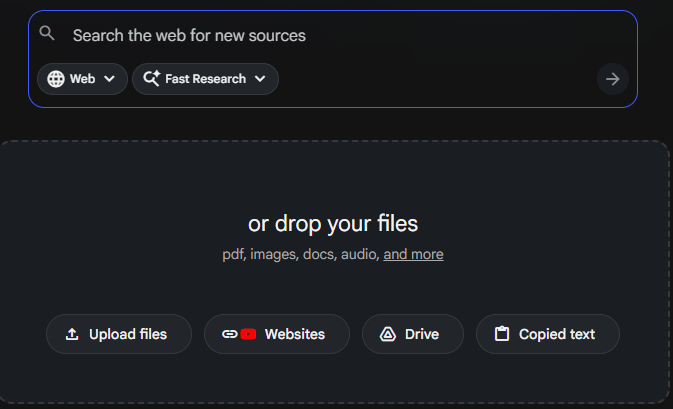
Once loaded, ask the following question based on the content of the PDF.
What are the required courses for a Minor in Artificial Intelligence and where do they appear in the PDF?
- Add a slide to the presentation that summarizes your results
Podcast
Long-form podcasts are valuable for in-depth conversations about particular topics. It is often useful to be able to summarize, extract, and query them if you don't have time to listen to them entirely. To do so, one can utilize a service like Gemini Notebook. Visit the service and create a new notebook. We'll use AI in this exercise to summarize, analyze, and fact-check long-form videos. Select from one of the following videos or find one of your choice that is over 45 minutes in length. Add it to your notebook.
- Consciousness and AI (https://www.youtube.com/watch?v=5QQun2pDQEs)
- Why the World Order is Collapsing (https://www.youtube.com/watch?v=v-2BdiL6r74)
- AI in space (https://www.youtube.com/watch?v=BYXbuik3dgA)
- AI in warfare (https://www.youtube.com/watch?v=6CAbZRpy4tQ)
- AI and government fraud (https://www.youtube.com/watch?v=d14_ZQOzBKw)
Then, run a set of queries summarizing discussions related to particular topics. Some queries to try are below.
Generate a list of the 3 ideas in this podcast that go against conventional wisdom? Where in the podcast is each one discussed? Perform an analysis on the potential validity of each one.
Find a discussion point that may not be true or is an unproven conspiracy theory that can be refuted by factual evidence. Where in the podcast is this point brought up? Find a specific source that may refute the point made.
Find a discussion topic that may be missing information that an informed co-host might have been able to add between the participants. Where in the podcast is this topic discussed? Identify someone who might have been a good additional co-host.
Pull out some of the most interesting insights that you found via this exploration.
- Add a slide to the presentation that summarizes your results and/or observations.
Spreadsheet
Notebooks can be used to also process Excel documents uploaded from your computer or accessible via Google Drive. In this exercise, the history of CS course offerings from 2020 to 2025 has been uploaded to the week's Google Drive folder. Create a new notebook and add the spreadsheet to it (CS Courses.csv). Then, pick a 20-course range in the 400s beyond 410 (e.g. 420 to 440) and prompt the notebook for the instructors who have taught them.
Can you identify all instructors who have taught CS courses numbered between <FMI>
and <FMI> and the courses they have taught?
Next, ask for the most popular course in the range.
Find the most popular course in terms of enrollment between <FMI> and <FMI>
Then, find all courses an instructor has offered in the past.
Find all courses offered by <FMI> and list the course and the term it was offered.
- Add a slide to the presentation that summarizes your results of the three queries
Web site
Notebooks can be used directly on web content given a URL. In this exercise, we'll utilize the Graduate Handbook for Portland State University's Department of Computer Science. Begin by visiting the URL for the handbook and examining its content:
One useful function for an LLM is to take a large amount of information and create a frequently asked questions (FAQ) page that might answer common questions a person might have. For this exercise. Prompt the model to generate an FAQ.
Generate a 5-question FAQ representing common questions someone might have about
the graduate program in Computer Science.
- Add a slide to the presentation that summarizes your results
There are a variety of output formats that a Notebook can produce. In this exercise, we'll experiment with Mind Maps for providing visual overviews of content, Flashcards for studying, and Quizzes for exam preparation. In this exercise, a large document containing famous quotes has been uploaded to the week's Google Drive folder. Open the document (FamousQuotes.docx) and familiarize yourself with the contents.
Create a new notebook and add the document to it. Then, navigate to the Studio window and examine the various output products that can be generated.
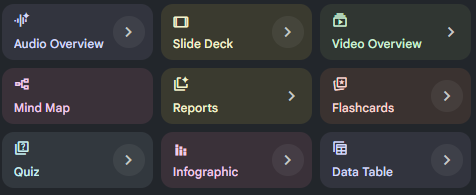
Generate a Mind Map, an Infographic, Flashcards, and a Quiz, using the document.
A Mind Map shows a visual overview that the service produces from the quotes.
- Go through the Mind Map to expand out each topic. Hover over the references to see where in the original document it pulled the content from.
Flashcards provide study aids for recalling material
- Go through the Flashcards, guessing the answer to each one, checking the answer, and grading whether or not you correctly answered each.
A Quiz simulates a multiple choice exam
- Go through the Quiz and attempt to answer each question.
Finally, an Infographic attempts to summarize the content in an informational imae.
- View the Infographic after it has been generated
From the output generated,
- Add a slide to the presentation that shows each output
Gemini Notebook can produce a wide variety of outputs. While you have seen some of this with Mind Maps, Flashcards, Quizzes, and Infographics, other rich content can also be produced. For your homework, you will explore the use of notebooks to produce additional types of output that are based on content related to your discipline of study. If you have difficulty finding sources for your discipline, two documents have been provided in the Google Drive folder: an introductory lecture on Cloud Computing (CloudOverview.pdf) and a cheat-sheet for learning the Python programming language (PythonCheatSheet.pdf).
Specifically, using content you provide in a notebook, you will generate the following output products and summarize the quality and usefulness of what was generated
- Audio overview
- Video overview
- Slide Deck
- Data Tables
- Reports
Screencast
Upon completing your exploration, via a narrated screencast of no longer than 5 minutes, you will perform a demonstration and walk-through of your results. Ensure that the video camera is turned on initially in your screencast.
Rubric
We will be using the following rubric to evaluate your homework.
|
|
Submission
Upload your completed screencast on MediaSpace. Ensure that it is published as "Unlisted". Then, in Canvas, submit the URL that your unlisted screencast on MediaSpace is located.